Maximizing Profitability
Leveraging sophisticated machine learning models and technical indicators to identify high-probability trading opportunities, aiming to enhance profitability through data-driven insights.

Built to reduce trading risk while maximizing return potential over time


Leveraging sophisticated machine learning models and technical indicators to identify high-probability trading opportunities, aiming to enhance profitability through data-driven insights.


From pulling market data and calculating indicators to executing trades and generating reports—eliminating the need for manual intervention. This hands-free approach ensures consistent operation and minimizes human error.


Each trade is executed in line with predefined risk tolerance levels, ensuring that trading decisions are aligned with the risk profile of each account. This built-in risk management mitigates the chances of substantial losses.


Designed to accommodate growth, XLR8 can efficiently scale to handle an increasing number of trading accounts, market data sources, and asset classes without sacrificing performance or accuracy.


Connects directly with real-time market data providers to ensure accurate data retrieval. The data is processed and stored using a scalable infrastructure.


Uses raw market data to publish technical indicators. These indicators, crafted from a deep understanding of market behavior, go beyond standard commercial and traditional indicators to recommend profitable trading decisions.


Leverages a powerful machine learning ensemble model that analyzes the system technical indicators. This model generates trade signals and adapts dynamically to changing market conditions.


Automates trade execution by integrating with a brokerage platform (Interactive Brokers). The system allocates trades based on each account’s available funds and risk profile, ensuring consistency in execution without manual intervention.


Designed to manage multiple trading accounts, each with distinct risk profiles. The system tracks and reports performance metrics on an account-by-account basis, offering a clear view of how each account is performing.

Installation

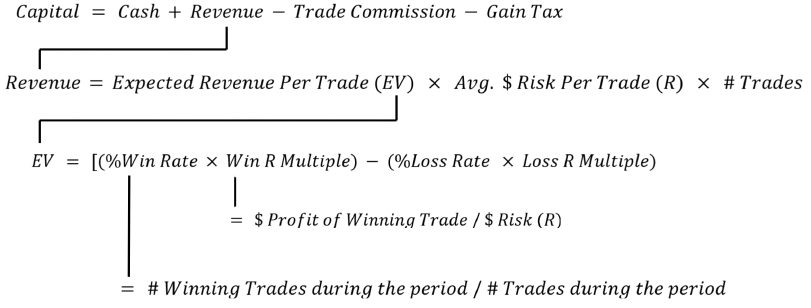
%Win R Multiple = $ Profit of Winning Trade / $Risk (R)
If we invest $100K in 2011, we observe the following capital metrics (FAQ.10 shows how XLR8 optimizes revenue)
Table.1: XLR8 revenue simulated for the period between 4/2011 and 9/2024


After-Tax Annualized Return of Investment (ATAROI):

Profit Factor (PF):

If we invest $100K in 2011, we observe the following profitability metrics
Table.2: XLR8 ROI simulated for the period between 4/2011 and 9/2024:


Drawdown (DD) & Max Drawdown (MDD):
Quantifies the most significant loss the system experienced before recovering


Ulcer Index (UI)


Moreover, as shown in Figure.2, the UI illustrates XLR8’s ability to recover from drawdown losses more swiftly than the benchmarks. Despite having the highest MDD in 2020, XLR8 recorded the lowest UI at 5.9, compared to 7.5 for SPY, 5.9 for QQQ, and 11.3 for BRK. This suggests that, while XLR8 faced deeper drawdowns, it rebounded more efficiently, resulting in smoother long-term equity growth. This trend is also evident in the years between 2018 and 2021.
Figure.2: Annual Avg. Ulcer Index and Max Drawdown Benchmark Metrics

Hi, I’m Nihad. I’ve spent the past 20 years working in analytics, where I’ve built systems and solutions that truly make an impact. I’ve always been fascinated by how data can drive better decisions, and throughout my career, I’ve refined my ability to turn complex data into meaningful insights that fuel innovation and strategy.
In 2014, I decided to take my love for data in a new direction—algorithmic trading. What started as a passion project quickly became an exciting challenge that brought together my interests in data science, finance, and technology. Teaching myself everything from scratch, I created XLR8, an advanced trading system that uses machine learning and technical analysis to generate reliable, data-driven signals.
I’m constantly looking for ways to learn and grow. To deepen my knowledge of financial systems, I pursued a Financial Engineering Master’s program and have connected with incredible thought leaders in the trading space. My mission now is to keep refining XLR8, explore new opportunities in trading, and share my journey with others who are curious about data and trading. Beyond the numbers and code, I’m passionate about helping others grow. Whether it’s mentoring junior analysts, sharing my experiences, or building tools that make data-driven decision-making more accessible, I want to inspire others to see what’s possible.
If you’re interested in the world of algorithmic trading or data science, let’s connect. I’d love to share ideas, learn from your perspective, and explore what’s possible together.